The Operational Question
When a data center's power bill rises, the first explanation is often that the IT load grew. That explanation may be right, but it can also hide a cooling problem: a failed economizer, an overactive humidification cycle, unnecessary fan speed, fouled coils, poor airflow management, or a control sequence that is keeping too much equipment online. Facilities managers need a repeatable way to tell the difference before they approve a capital project or accept a new operating baseline.
This post explains how to use PUE trends as a screening tool rather than a vanity number. You will learn how to pair facility power, IT power, temperature, humidity, airflow, and equipment status data; how to compare a current period with a valid baseline; and how to turn an unusual trend into a focused cooling investigation. The goal is not to blame the mechanical team or the IT team. The goal is to identify which part of the physical facility changed, what should be checked next, and which training will help the people responsible for the response.
Who This Affects
This approach is useful for facilities managers, critical facilities engineers, HVAC and mechanical technicians, energy managers, operations leaders, and site reliability teams who have to explain utility changes while protecting uptime. It is especially useful when electrical and mechanical responsibilities are split between an enterprise team, a colocation provider, a hyperscale operator, and several contractors.
The same reasoning applies across different site types, but the evidence available will vary:
- An enterprise site may have monthly utility data, a building management system, and limited submetering for IT halls.
- A colocation facility may need to separate tenant load growth from common-area cooling power and shared plant operation.
- A hyperscale site may have detailed power-distribution and cooling telemetry, but a much larger number of halls and operating modes to compare.
- An edge site may have only a UPS display, a small mechanical system, and manual meter readings, making a simple trend sheet more useful than a complicated dashboard.
The question often appears during a monthly energy review, a capacity-planning meeting, a cooling alarm investigation, a utility-budget variance, or a handover from a construction or commissioning team. It also appears when a manager is asked to justify adding another chiller, CRAH unit, or power train even though the actual constraint has not been isolated.
New facility engineers and technicians can benefit from this method because it teaches them to connect a trend to equipment and operating conditions. A PUE change is not itself a diagnosis. It is a signal that should lead to a disciplined walk-through and a documented hypothesis.
What Can Go Wrong
PUE is commonly expressed as total facility energy divided by IT equipment energy. A change in the ratio can therefore come from the facility side, the IT side, or the measurement method. If the team treats every increase as cooling waste, it may chase the wrong problem. If the team treats every increase as IT growth, it may miss a mechanical fault that is slowly consuming capacity.
Several consequences can follow from a weak interpretation:
- Cooling equipment may run at a more aggressive setpoint or fan speed than the actual rack conditions require, increasing energy use and reducing available plant margin.
- A stuck damper, failed sensor, or poor control sequence may keep an economizer, humidifier, pump, or redundant unit operating when the operating mode no longer calls for it.
- A fouled filter or coil can raise pressure drop and reduce heat-transfer performance, causing fans, valves, or compressors to work harder.
- Incorrect containment, missing blanking panels, cable openings, or poorly positioned floor tiles can create recirculation and hot spots that prompt the team to lower supply temperature across the room.
- A tenant or compute expansion can increase IT load without a proportional increase in facility energy, which may improve the ratio while still consuming available cooling and electrical capacity.
- A meter, data tag, timestamp, or aggregation rule can change. The resulting PUE movement may look operational even though the data definition changed.
The safety consequences are practical as well. Technicians who respond to an energy anomaly may work around energized switchgear, rotating equipment, pressurized refrigerant circuits, pumps, or elevated-temperature spaces. An energy review should never turn into an informal instruction to bypass interlocks, open a refrigerant circuit, defeat a control alarm, or work on equipment without the site's safe work process.
Compliance and reporting can also suffer when a site publishes a ratio without understanding its boundaries. PUE is an efficiency metric, not a complete description of resilience, safety, capacity, or environmental performance. A site can report a favorable ratio while lacking enough chilled-water, electrical, or standby margin for the next deployment. Conversely, a site can show a temporary ratio increase during a controlled test, seasonal transition, or maintenance event without having a persistent fault.
What Managers Should Check
Start with a narrow question and a matched comparison. Instead of asking, “Why is PUE worse?” ask, “What changed in facility energy relative to IT energy during the same operating conditions, and which cooling assets were active?” That wording helps the team collect evidence without assuming the answer.
1. Confirm the metric boundary
Before comparing dates, document what the numerator and denominator include. Check whether the facility figure includes chillers, cooling towers, pumps, CRAH or CRAC units, lighting, offices, security systems, battery charging, generators during testing, and other support loads. Confirm whether the IT figure is measured at the UPS output, PDU output, rack level, or another point.
Also check whether the comparison uses energy over the same interval. A monthly utility bill compared with a partial DCIM export can create an apparent trend that is really a time-window mismatch. Record meter names, units, time zone, interval length, missing-data treatment, and any manual adjustments.
2. Normalize the comparison
Use periods that are operationally comparable. A hot afternoon in July should not be compared casually with a mild night in April. At minimum, note:
- Outdoor dry-bulb temperature and humidity.
- IT load level and major deployment or retirement events.
- Occupancy, maintenance windows, and test activities.
- Chiller, cooling-tower, CRAH, pump, and economizer operating modes.
- Supply and return temperature targets, humidity controls, and alarm conditions.
If the site has enough data, compare similar hours of the week and similar weather conditions. If it does not, create a simple baseline from several normal weeks rather than using one convenient day.
3. Separate load growth from cooling intensity
Look at absolute values as well as the ratio. A higher IT load can increase total energy while leaving PUE stable. A facility problem may show up as facility energy rising faster than IT energy, but a ratio alone does not tell you which asset caused it.
Create a small table with at least these columns:
- IT energy and peak IT demand.
- Total facility energy and peak facility demand.
- PUE for the interval.
- Cooling-plant energy, if available.
- Outdoor conditions.
- Number and type of cooling assets operating.
- Notable alarms, maintenance, or control changes.
This makes it easier to distinguish a steady capacity expansion from a step change in cooling intensity. A persistent increase beginning after a control-system change deserves a different investigation from a gradual seasonal increase that tracks outdoor conditions.
4. Check operating state before inspecting individual components
Review the sequence of operation and actual status points. Ask whether the cooling plant was in mechanical cooling, economizer, mixed, or a special override mode. Check whether redundant equipment was enabled, whether lead-lag rotation changed, and whether a unit was forced into manual control.
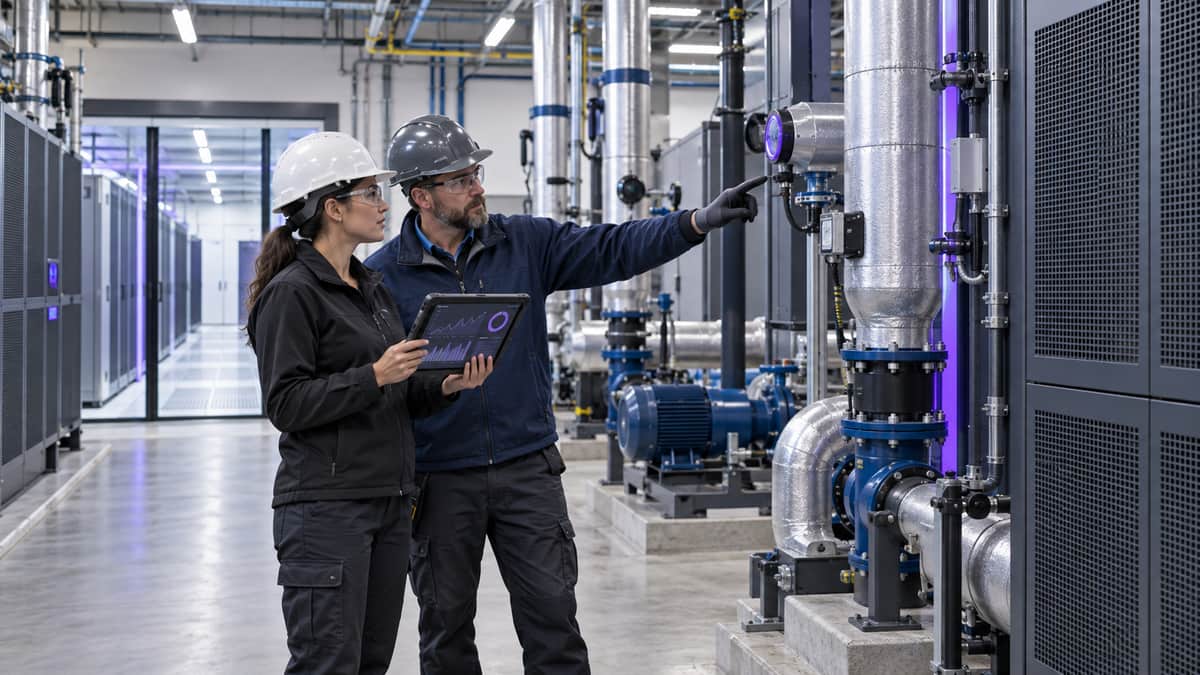
For CRAH or CRAC units, compare fan speed, valve position, return temperature, supply temperature, and alarm status. For chilled-water systems, compare differential pressure, pump speed, entering and leaving water temperatures, and valve positions. For air-cooled or water-cooled chillers, review compressor loading, condenser conditions, tower fan operation, and any high-head or low-flow alarms.
The objective is not to make a remote diagnosis from a dashboard. It is to identify the smallest useful field check. For example, if several units show high fan speed while room return temperatures are low and airflow alarms are absent, the team can inspect the control sequence and pressure relationship before replacing equipment.
5. Walk the affected room and plant
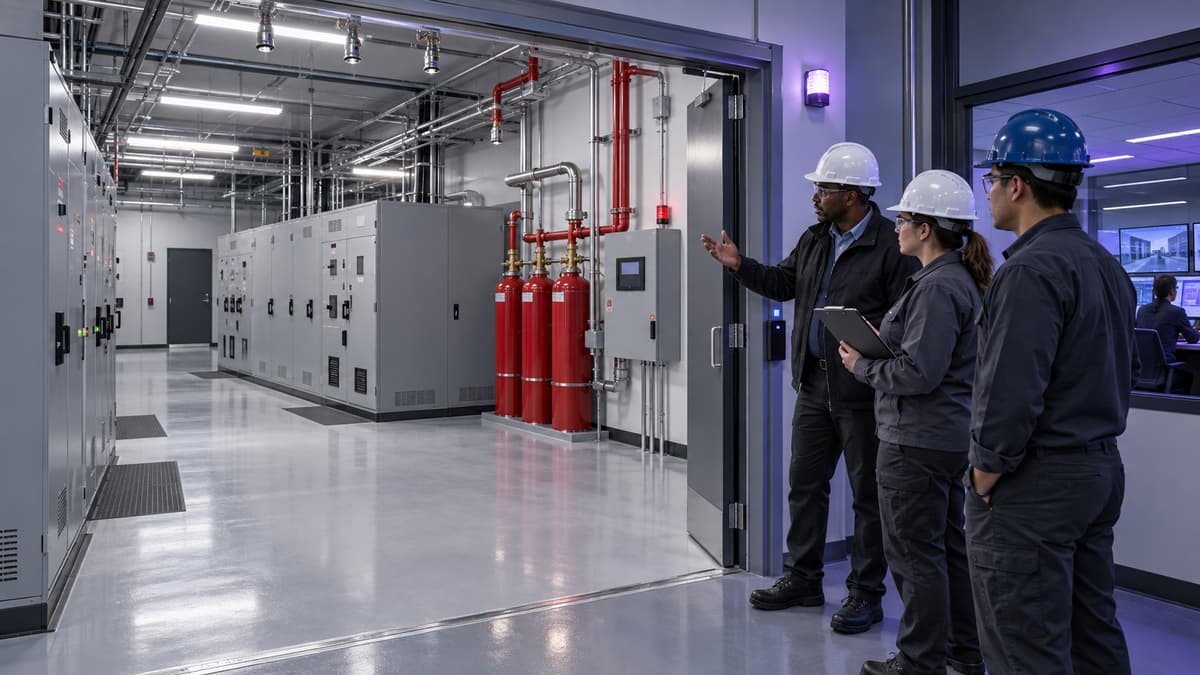
Trend data should lead to a physical verification. Have a qualified technician confirm whether the observed operating state matches the screen. Look for:
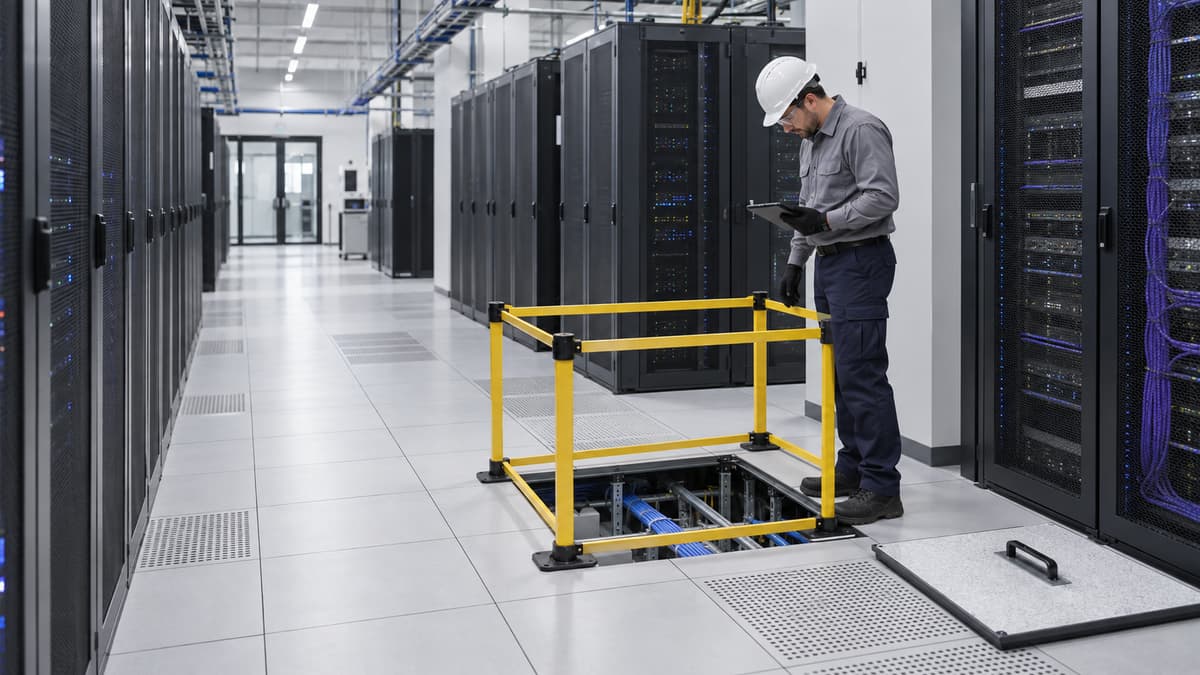
- Missing or displaced blanking panels and open cable penetrations.
- Supply-air obstructions, blocked filters, dirty coils, or unusual air noise.
- Floor tiles or grilles that do not match the intended airflow plan.
- Condensation, water leaks, unusual vibration, belt or bearing noise, and visible corrosion.
- Dampers, valves, actuators, and sensors that do not respond as expected.
- Portable heaters, temporary fans, contractor equipment, or construction barriers that alter airflow.
Document the room, asset identifier, time, readings, and photographs according to site policy. Do not use a walk-through as permission to open panels or enter restricted spaces outside the worker's training and authorization.
6. Test one change at a time
If the site process allows an adjustment, define the expected result, the rollback condition, and the person responsible for watching the system. Do not lower supply temperature, disable a unit, change a pressure setpoint, or alter an economizer sequence merely to make the trend look better.
A controlled test might compare two equivalent CRAH groups, verify a sensor against a calibrated reference, or observe a lead-lag rotation during a planned window. Record the before-and-after conditions, including rack inlet temperatures, alarms, fan or pump speed, and facility power. A successful test should improve the suspected mechanism without creating a new hot spot or reducing resilience.
7. Close the loop with a durable action
Classify the finding as a data-quality issue, operating-sequence issue, maintenance issue, airflow issue, capacity issue, or training issue. Assign an owner and due date. If a technician could not tell whether a point was a command or a status, or if a manager could not identify the correct safe work procedure, capture that as a training gap rather than leaving it as tribal knowledge.
Which Training Fits This Situation
For a facilities manager who needs to interpret the trend and coordinate a response, Energy Efficiency & PUE Optimization is the most direct starting point. It fits the question of how facility energy, IT energy, operating conditions, and efficiency decisions should be evaluated together. It is a knowledge course with a certificate of completion, not a regulatory certification or an endorsement by a standards organization.
If the investigation reaches design assumptions, temperature management, or plant-level optimization, Cooling Systems Design & Optimization adds the broader cooling perspective. It is useful for engineers and managers who need to discuss chilled-water architecture, airflow strategy, and efficiency tradeoffs with design teams or contractors.
Technicians who will verify equipment conditions may need HVAC Systems Troubleshooting Essentials and Mechanical Systems & Equipment Maintenance. Those courses support a role-based plan for reading symptoms, checking mechanical equipment, and documenting maintenance findings. The right assignment depends on what the technician is authorized and expected to do at the site.
For a team that owns both the design context and the operational follow-through, the Cooling & Facilities Efficiency Bundle groups the relevant cooling and efficiency subjects into one role-based path. A manager can still assign individual courses when only one role needs a focused skill. The useful decision is not whether every employee needs the entire catalog. It is whether the team has a shared baseline for interpreting energy data and a practical path for the people who will verify the physical plant.
A sensible plan may look like this:
- Facilities manager: Energy Efficiency & PUE Optimization, followed by Cooling Systems Design & Optimization when capital or plant decisions are part of the role.
- HVAC or mechanical technician: HVAC Systems Troubleshooting Essentials, Mechanical Systems & Equipment Maintenance, and the site's equipment-specific procedures.
- Operations or monitoring staff: the local BMS and alarm-response procedures, plus enough PUE context to recognize when a trend needs escalation.
- Training coordinator: a short scenario review that connects the course concepts to one real plant trend, one walk-through, and one documented corrective action.
The certificate of completion can document participation in the training plan, while the site still determines authorization, supervised practice, qualification, and safe work requirements for each task.
Common Mistakes to Avoid
- Treating PUE as a scorecard without recording the meter boundary, weather, IT load, and operating mode.
- Comparing a current month with a historical month that had different occupancy, maintenance, or commissioning activity.
- Looking only at the ratio and ignoring absolute facility energy, peak demand, and cooling-plant behavior.
- Assuming a low PUE proves that the site has adequate cooling or electrical capacity for the next deployment.
- Lowering room temperature as the first response to a hot spot without checking containment, blanking panels, sensors, airflow, or rack-level conditions.
- Changing several setpoints at once, which makes it impossible to know which action helped or harmed the system.
- Treating a BMS command as proof that a valve, damper, fan, pump, or compressor actually moved.
- Asking a technician to investigate energized or pressurized equipment without confirming training, authorization, PPE, and the site's safe work process.
- Buying another cooling asset before ruling out a sensor, sequence, airflow, maintenance, or data-quality problem.
- Assigning a broad training catalog without connecting each course to the employee's role and the site's procedures.
Key Takeaway
Use PUE trends to frame the investigation, not to declare the cause. A sound review connects the ratio to absolute energy, IT load, weather, cooling-plant state, room conditions, and the people authorized to verify the equipment. This week, choose one recent PUE variance, confirm its meter boundary, and walk the associated cooling assets with the technician who owns the next check.